
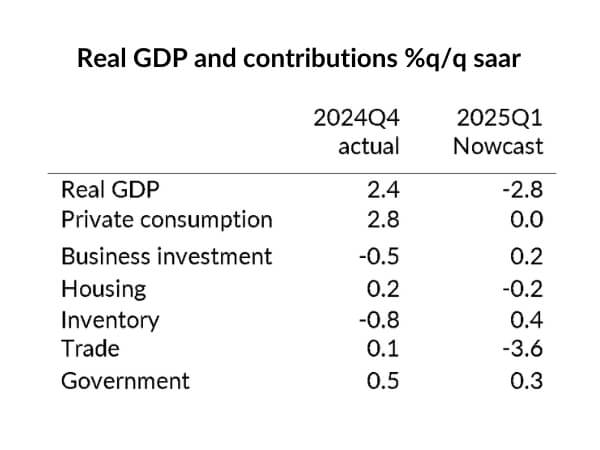
Financial markets had a rough time during the first two months of the new Trump presidency. The S&P500 dropped 10.1% between February 19 and March 13, the VIX surged more than 10 points and credit spreads have widened across the board.1 Market volatility appears to be driven by uncertainty over US economic policy, especially trade policy, as well as weaker economic data, summarized in the sudden shift of the Atlanta-Fed GDPNow estimate for 2025-Q1 real GDP growth from +2.3% to -2.8%.2
In our view, growth is likely to be soft in the first quarter, but we think the sources of that weakness are temporary special factors (weather effects and tariff frontloading, see footnote 3 for details).3 Indeed, growth was also weak in early 2022 but that did not lead to a recession (see footnote 4 for detail).4
More concerning to us would be a prolonged deterioration in financial conditions and economic sentiment plus signs that policy changes undermine the economic fundamentals that made the US growth performance so exceptional in recent years.5
Against that background, we take a closer look at the business sector and the relevant credit markets. Business and credit fundamentals look solid to us and we view yields as still attractive; nevertheless, we have reduced overall and policy-related risks.
As we outlined in the last issue of ZAIS Insights, US economic outperformance over the last five years was built on strong employment and productivity growth.6 In our view, the business sector both benefits and contributes to these favorable supply conditions. The strength of the US business sector is most visible in record high profit margins (see Chart 1).

*EBITDA = Earnings Before Interest, Taxes, Depreciation and Amortizations (net operating surplus); EAT = Earnings After Taxes (and all other non-operating expenses).
Source: Bureau of Economic Analysis
7
The biggest lift in profit margins came from productivity gains which more than offset the rise in real labor costs.8 The narrowing gap between operating margins (EBITDA) and profit margins after taxes (EAT) is noteworthy, mostly driven by the falling share of net interest payments.9
We see the strength of the US business sector also reflected in healthy credit fundamentals. Businesses appear overall to have adjusted well to higher interest rates and we see no large operating and balance sheet imbalances. The leverage ratio for nonfinancial corporates is at the low side of the historical range and the interest coverage ratio is near its historical high despite the rise in interest rates (see Chart 2).

*Leverage = Debt/EBITDA; Interest coverage = EBITDA/interest payments.
Source: Federal Reserve Board and Bureau of Economic Analysis
10
A vibrant business sector is good for labor demand and investment spending, which in turn is supportive for overall economic growth. We see this robust business performance as having benefitted from external developments, notably the immigration boom, the surge in shale-gas exploration and fiscal pump-priming, while much of the productivity gains are concentrated in the IT sector.11
Still, the ability of US firms to persistently innovate and put new technologies and products to wider use suggests to us broad institutional and structural advantages that are unique to the US economy.12
Turning to the relevant ZAIS investment universe, we note that high-yield bonds and leveraged loans have both weathered COVID and Fed tightening well and credit spreads are basically back to pre-Covid levels despite the most recent widening (see Chart 3).

Source: JPMorgan13
However, leveraged loan spreads have tightened less than high-yield spreads since 2022. In our view, leveraged loans have been more impacted by Fed tightening (floating rates) than high-yield bonds (fixed rates), while credit quality has been weaker, especially for loans from private issuers. This is also reflected in higher leverage ratios, lower interest rate coverage ratios and higher default rates of leveraged loans versus high-yield bonds (see Table).14

Latest is 2024-Q3 except default rate is Feb-2025. EBITDA margin and default rate are in % and leverage and interest coverage are ratios.
Source: JPMorgan15
CMBS is the other business-related asset class within ZAIS’s investment portfolio that has felt the impact of higher interest rates. Overall, we think CMBS is on a good recovery path but bifurcations between property types and vintages remain significant.
Chart 4 suggests that the office sector is most strained, due the structural reduction in demand caused by hybrid work models, elevated improvement costs and refinancing pressures due to higher rates, while industrial properties continue to benefit from the e-commerce trend.
Multifamily has come under pressure due to a wave of new deliveries in certain sunbelt locations but we expect that continued strong housing demand will absorb the extra capacity in relatively short time.

Source: Trepp16
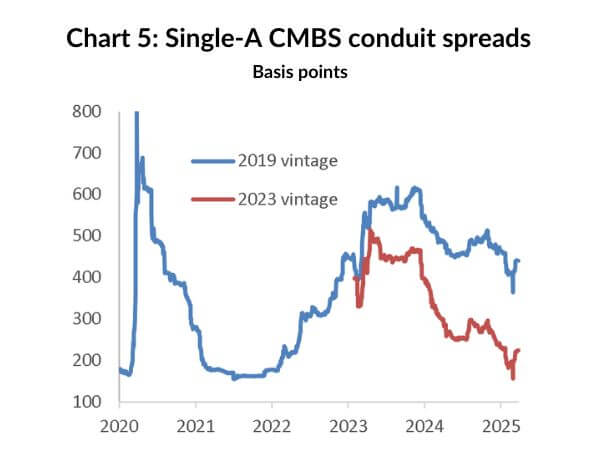
The differences are also visible between vintages. Seasoned vintage mezzanine tranches with loans underwritten at lower interest rates and looser credit standards have underperformed more recent vintages as market participants expect declining payoff rates and increased loan workouts. (see Chart 5).17
Source: JPMorgan18
Whether the good times for US business and related credit markets will keep on rolling depends significantly on the impact of the new administration’s policy agenda. In our view, the policy rollout is a dynamic process and it will take time until the full impact becomes clear. We see positive aspects but are concerned that the balance of all policy measures could be more harmful than beneficial for the business sector.
We agree that cutting back red tape and regulations can improve business efficiency, unshackle the economy, lift growth and lower inflation. But the effects can also be damaging if the framework of prudential standards and institutions that facilitate and safeguard business operations and contributed to the exceptional performance in recent years is undermined.19
In our view, a further escalation of the tariff conflict and an aggressive immigration crackdown that strangles the labor supply offset any positive effects for businesses from an extension of the Tax Cuts and Job Act.
And while the direct policy impact may take some time to materialize, we fear that the damage could come faster if ongoing policy uncertainty deteriorates economic sentiment and financial conditions further (see Chart 6).

US economic policy uncertainty soared to the highs of the COVID period and far exceeds any prior recession over the last 40 years including the great financial crisis.
Source: Baker, Bloom and Davis20
Looking ahead, we view yield levels as sufficiently high to remain fully invested but we have reduced our risk profile given prevailing uncertainties and still high market valuations.21
In leveraged loans, we focus even more on careful bottom-up credit analysis and we strictly limit the exposure in credits below B2/B, especially in sectors that we view as risky for policy or idiosyncratic reasons.
We have pared exposures in sectors and issuers that have large cross-border business operations and are vulnerable to supply-chain disruptions or input-price increases due to tariffs. These include automobile, building materials, chemicals, consumer products, high tech, packaging, and retail.
In the oil & gas sector, we expect that deregulation and a pro-drilling environment will result in supply increases and reduced prices, creating margin pressures for upstream producers but providing opportunities for downstream operators.
We remain cautious on healthcare, which we view as already fragile due to past regulatory changes, aggressive reimbursement policies from health insurers, the strains from COVID, cost inflation and labor shortages.
Against that background and given the complexity of the sector, we think that the impact of any policy changes must be analyzed on a case-by-case basis.
We expect that a prolonged crackdown on immigration that leads to a tightening in labor supply will be felt by issuers that rely on low-cost workers, notably in hospitality and leisure but also healthcare.
Finally, while we think that the business sector as a whole has absorbed interest rate increases well, we are mindful that there are weak credits in any sector (but in particular real estate) that are likely to come under pressure should interest rates rise further because of inflation and crowding-out effects in the capital market.
In terms of asset classes, we think that CLOs still offer good value for investors. First, we believe CLOs provide good default protection given the loan diversification across CLO portfolios, structural protections and reinvestment capabilities.
Second, while spreads of CLO debt are tighter than they have been in years, the all-in yield is still attractive up and down the cap stack depending on risk appetite, from mid-single digit returns on the AAAs up to high single / low double digit returns on lower mezzanine tranches (see Chart 7).
We also think that spread tightening has created an attractive entry point for CLO equity, both in the primary market as well as with opportunities to restructure existing CLOs to lock in the tighter financing available in the market today.

Source: JPMorgan22
In CMBS, we took profit in recent conduit vintages given spread compression over the last 12-18 months.22 We now prefer more seasoned conduit vintages where spreads have stayed wider due to credit noise (tenant lease events, downgrades, declining payoff rates, etc.).
We are focusing on 2017-2019 vintages which are not immediately maturing and with loans that have not been underwritten during peak valuations periods (notably 2020-21). Furthermore, we prefer structures that we view as loss remote in downside scenarios with 10% to 15% credit support in subordinated tranches. In terms of credit ratings, we see the best risk-reward relationships in A and BBB flat.
Finally, we look for conduit structures with diverse property pools and avoid pools with high concentrations in near-term lease expirations, office properties that have not been updated recently and hotels that have failed to fully recover post COVID.
As always, we are available to discuss our views with you. Please contact your Client Relations representative at +1 732 978 9722 or zais.clientrelations@zaisgroup.com


The information presented herein has been prepared and provided by and is confidential and proprietary to ZAIS Group, LLC, ZAIS Group (UK) Limited and their affiliates and subsidiaries (collectively, “ZAIS”). Accordingly, this material is not to be reproduced in whole or in part or used for any purpose except as authorized by ZAIS, is to be treated as strictly confidential and is not to be disclosed directly or indirectly to any party other than the recipient. By accepting receipt of this document, the recipient agrees to comply with this restriction and confirms its understanding of the limitations set forth in these disclaimers.
Unless otherwise noted, the source of information for the charts, graphs, and other materials contained herein is ZAIS. The charts, tables, and graphs contained in this document are not intended to be used to assist the reader in determining which securities to buy or sell or when to buy or sell securities. Additional information is available upon request.
This information has been prepared solely for informational purposes and is not an offer to buy or sell or a solicitation of an offer to buy or sell any security or instrument or to participate in any trading strategy which may or may not be made available. Any such offer of securities would, if made, be made pursuant to definitive final private offering documents, which would contain material information not contained herein (including certain risks) or material that differs from the information contained herein and to which current and prospective investors are referred. Any decision to invest should be made solely in reliance upon such private offering documents. In the event of any such offering, this information shall be deemed superseded, amended and supplemented in its entirety by such private offering documents. Information contained herein does not purport to be complete and is subject to the same qualifications and assumptions, and should be considered by investors only in the light of the same warnings, lack of assurances and representations and other precautionary matters, as disclosed in an applicable private offering memorandum and subscription agreement. No representation or warranty can be given with respect to the terms of any offer of securities conforming to the terms hereof. There is no guarantee that the strategies set forth herein will be successful. The information should only be considered current as at the date specified herein and is subject to change at any time and without notice. Statements made herein that are not attributed to a third party source reflect the views and opinions of ZAIS.
Certain information contained herein represents ZAIS's current reasonable opinion and is based on unaudited and forecast figures which have been derived from multiple sources and have not been subject to specific due diligence. The information has been provided in good faith but is not guaranteed and is subject to uncertainties beyond ZAIS's control and should not be relied upon for the purposes of any investment decision. ZAIS makes no representations or warranties and accepts no liability whether in contract, tort or otherwise for (1) the information not being full and complete, (2) the accuracy of any opinion, (3) the basis on which any comparison has been drawn or the facts selected to make such comparison and (4) the assumptions underlying any opinions. ZAIS does not undertake to update its opinions. No opinion of this nature can be, and this information does not purport to be, full, complete, comprehensive or to contain all relevant information. Statements made herein that are not attributed to a third party source reflect the views and opinions of ZAIS.
These materials may contain statements that are not purely historical in nature but are “forward-looking statements”. In some cases, you can identify forward-looking statements by terms such as “anticipate,” “believe,” “could,” “estimate,” “expect,” “intend,” “may,” “plan,” “potential,” “should” and “would” or the negative of these terms or other comparable terminology. These forward-looking statements include, among other things, projections, forecasts, estimates or hypothetical calculations with respect to income, yield or return, future performance targets, sample or pro forma portfolio structures or portfolio composition, scenario analysis, specific investment strategies or proposed or pro forma levels of diversification or sector investment. These forward-looking statements are based upon certain assumptions, some of which are described herein. Prospective investors are cautioned not to place undue reliance on such statements. No representation is made by ZAIS as to the accuracy, validity or relevance of any such forward-looking statement and the recipient agrees it is solely responsible for gathering its own information and undertaking its own projections, forecasts, estimates and hypothetical calculations. Actual events are difficult to predict, are beyond ZAIS’s control, and may substantially differ from those assumed. All forward-looking statements included herein are based on information available on the date hereof or such date specified and ZAIS does not assume any duty to update any forward-looking statement contained herein. Some important factors which could cause actual results to differ materially from those in any forward-looking statements include, among others, the actual composition of the investment portfolio, any defaults to the investments, the timing of any defaults and subsequent recoveries, changes in interest rates, changes in currency rates and any weakening of the specific obligations included in the portfolio. Accordingly, there can be no assurance that estimated returns or projections can be realized, that forward-looking statements will materialize or that actual returns or results will not be materially lower or higher than those presented. The value of any investment, and the income from it, may fall as well as rise. Accordingly, there can be no assurances that an investor will receive back all or any of the original capital invested. Further, the eligible investments may be leveraged and the portfolio of eligible investments may lack diversification thereby increasing the risk of loss.
ZAIS Group (UK) Limited is a company registered in England with number 08908933 and whose registered office is c/o Dixon Wilson, 22 Chancery Lane, London WC2A 1LS, United Kingdom. ZAIS Group (UK) Limited is an appointed representative of Infinity Asset Management LLP, which is authorized and regulated by the Financial Conduct Authority in the United Kingdom. ZAIS Group (UK) Limited’s status as an appointed representative of Infinity Asset Management LLP does not imply a certain level of skill or training. Investors will not benefit from the rules and regulations made under the Financial Services and Markets Act 2000 for the protection of investors, nor from the Financial Services Compensation Scheme in the United Kingdom. Nothing herein excludes any liability which ZAIS is not permitted to exclude by applicable law.
ZAIS Group, LLC’s registrations with the Securities and Exchange Commission (the “SEC”) and the Commodity Futures Trading Commission (the “CFTC”), and ZAIS Group (UK) Limited’s status as an appointed representative of Infinity Asset Management LLP (which is authorized by the United Kingdom’s Financial Conduct Authority (“FCA”), does not imply a certain level of skill or training.